Sprint Health
The Sprint Health tab gives a single 0-100 score plus a transparent breakdown of how that score was built.
The score (0-100)
Section titled “The score (0-100)”| Range | Badge | Meaning |
|---|---|---|
| 70-100 | Healthy | Sprint is on track. |
| 40-69 | At Risk | Watch closely - one slip and the sprint misses. |
| 0-39 | Critical | Take action - re-scope, re-assign, or de-commit. |
How the score is built
Section titled “How the score is built”The score is a weighted combination of five components. Component names are visible in the 📊 Score Breakdown panel on the Sprint Health tab; the panel shows each component’s current value and a percentage lozenge.
| Component | Roughly measures |
|---|---|
| Progress vs Time | Are you completing items as fast as the sprint clock is ticking? |
| Blocked Items | The share of issues that are flagged or blocked. |
| Scope Stability | How much the sprint scope has grown since the start. |
| Team Balance | Whether workload is distributed evenly across the team. |
| Velocity Trend | How this sprint’s pace compares to recent history. |
The exact weights are tuned by Bytera and may evolve. The breakdown panel always shows the current contribution of each component so you can see what’s pulling the score up or down.
Delivery scenarios
Section titled “Delivery scenarios”Alongside the score, SyncUp projects three completion percentages:
- Optimistic - current daily rate continues and every in-progress item finishes today.
- Realistic - current daily rate continues. This is the number on the header badge.
- Pessimistic - current daily rate drops by 30%.
The daily velocity (items completed per day so far) is shown next to the projections so you can sanity-check the numbers.
Forecast confidence
Section titled “Forecast confidence”Based on the realistic projection, the header badge shows one of three labels:
- On Track (green) - you’re projected to comfortably finish the committed work.
- At Risk (yellow) - possible to miss; watch closely.
- Off Track (red) - current pace won’t deliver the commitment.
Snapshots - the data behind the trend
Section titled “Snapshots - the data behind the trend”Every hour, SyncUp captures a snapshot of the active sprint into Forge SQL. Each snapshot records: total items, completed items, blocked count, time elapsed, and the health score.
Snapshots power:
- The Scope Stability component (compares current scope with the earliest snapshot).
- The scope creep alert (≥10% scope growth versus the initial snapshot).
- The Sprint Report (autopsy) - see Sprint Autopsy for what gets summarized at sprint close.
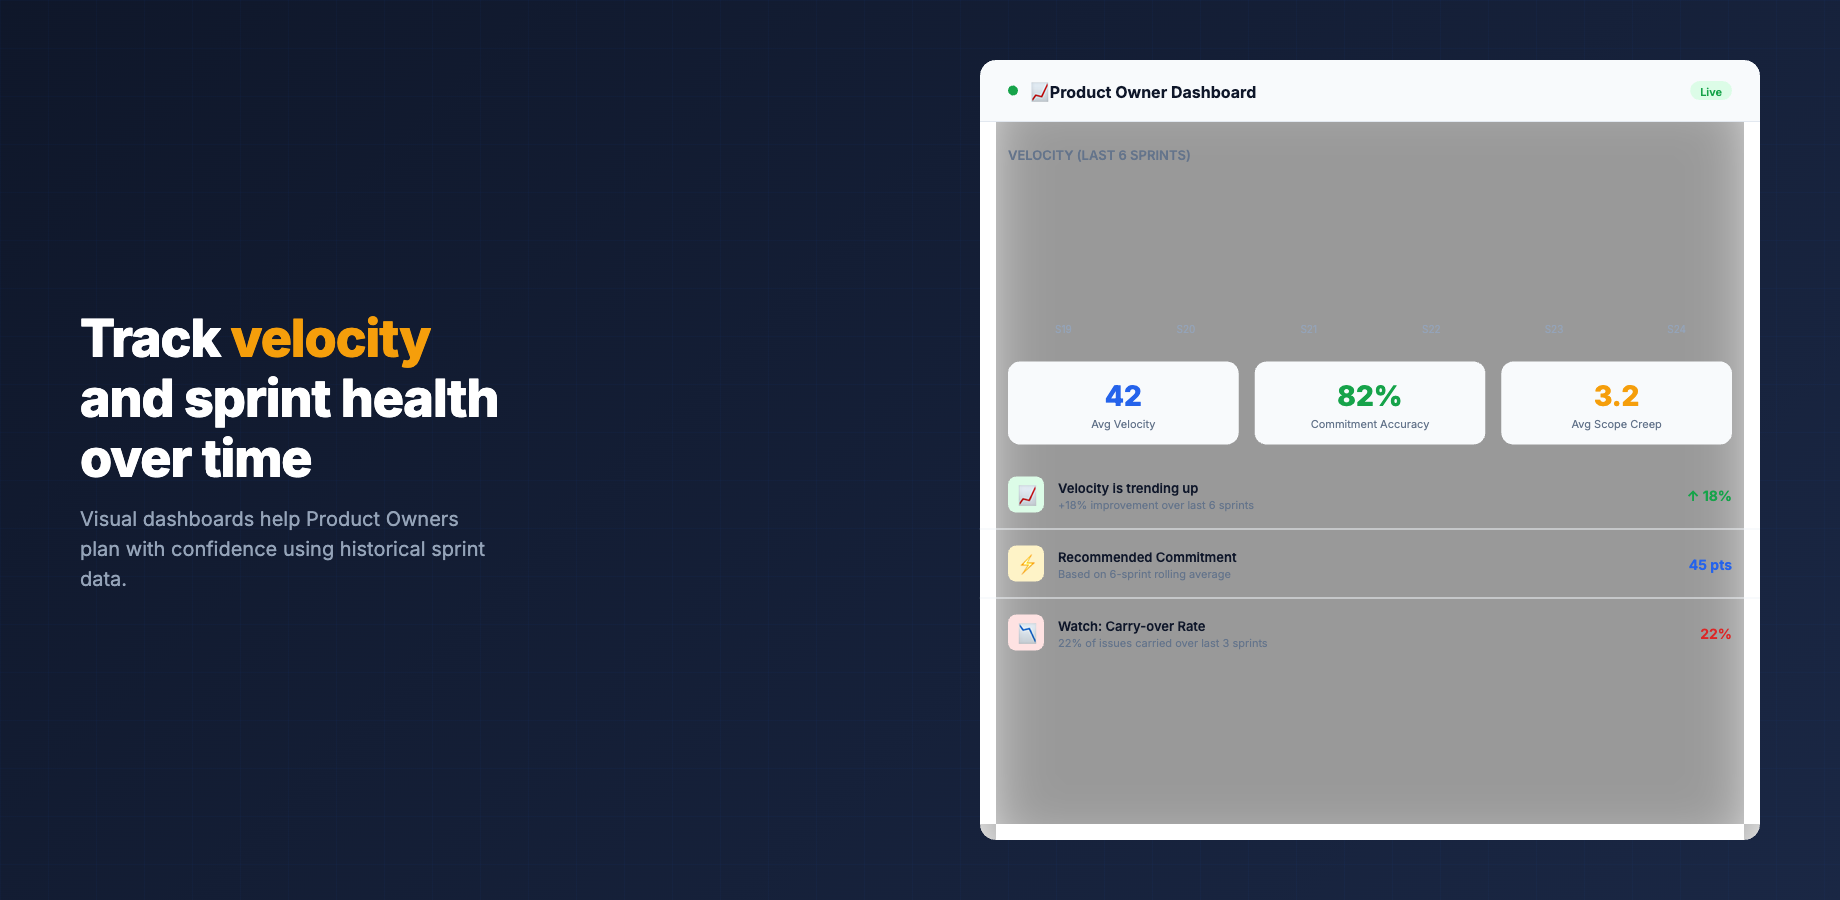
- The Velocity Trend shown in the Product Owner brief and Reports tab.
Team workload (below the score)
Section titled “Team workload (below the score)”The Sprint Health tab finishes with a full Team Workload table - each assignee’s total items, plus a status badge:
- Overloaded - > 1.5× team average
- Available - < 0.5× team average
- Balanced - everyone else
This is the same data the Scrum Master brief uses to generate rebalancing suggestions.
- Sprint Autopsy - the report generated when a sprint closes.
- Velocity Tracking - how snapshots and reports combine into a velocity view.